A failed request rarely arrives with a complete story.
It usually arrives as a support complaint, a vague alert, a strange status code, a provider error, a timeout, or a customer saying something did not work.
Then the real work begins.
An engineer opens logs. Then traces. Then metrics. Then the database. Then a provider dashboard. Then Slack. Then a support ticket. Then more logs, this time with a different timestamp filter.
Somewhere inside that scattered evidence is the actual execution: what the system received, what it decided, what it called, what failed, what it returned, and why.
Most production investigations are not hard because there is no data.
They are hard because the data is scattered across tools, formats, timestamps, identifiers, and mental models.
That is the problem we are building Foveus to solve.
Telemetry is useful. It is not always enough.
Logs, metrics, and traces all matter.
Logs tell you what the application wrote down.
Metrics tell you what changed.
Traces show where a request travelled.
Those are useful lenses. Foveus is not being built on the idea that existing observability tools are useless. They are not. Good logs help. Good metrics help. Good traces help.
But during many backend investigations, the engineer is not asking only:
Did latency increase?
Or:
Which services did this request touch?
Or:
Was there an error log around this time?
The engineer is usually asking something more specific:
What happened inside this unit of work, in what order, with what context, and what evidence explains the outcome?
That question is about execution.
The missing object is often the execution itself.
Backend systems do not fail as dashboards. They fail as executions.
An order was submitted.
A payment was attempted.
A webhook was received.
A background job retried.
A provider returned a response the application did not expect.
A request completed successfully at the HTTP layer but failed at the business layer.
These are not just log events. They are units of work.
The problem is that most teams still reconstruct those units of work manually.
They search by requestId, then by customerId, then by transactionId, then by provider reference. They compare timestamps. They inspect logs. They check whether the trace includes the right span. They look for the response body. They ask whether the database write happened before or after the provider timeout.
They try to understand whether the system failed, retried, skipped a step, mapped a response incorrectly, or returned the wrong outcome.
The execution exists.
But too often, it exists only in the engineer’s head after several rounds of reconstruction.
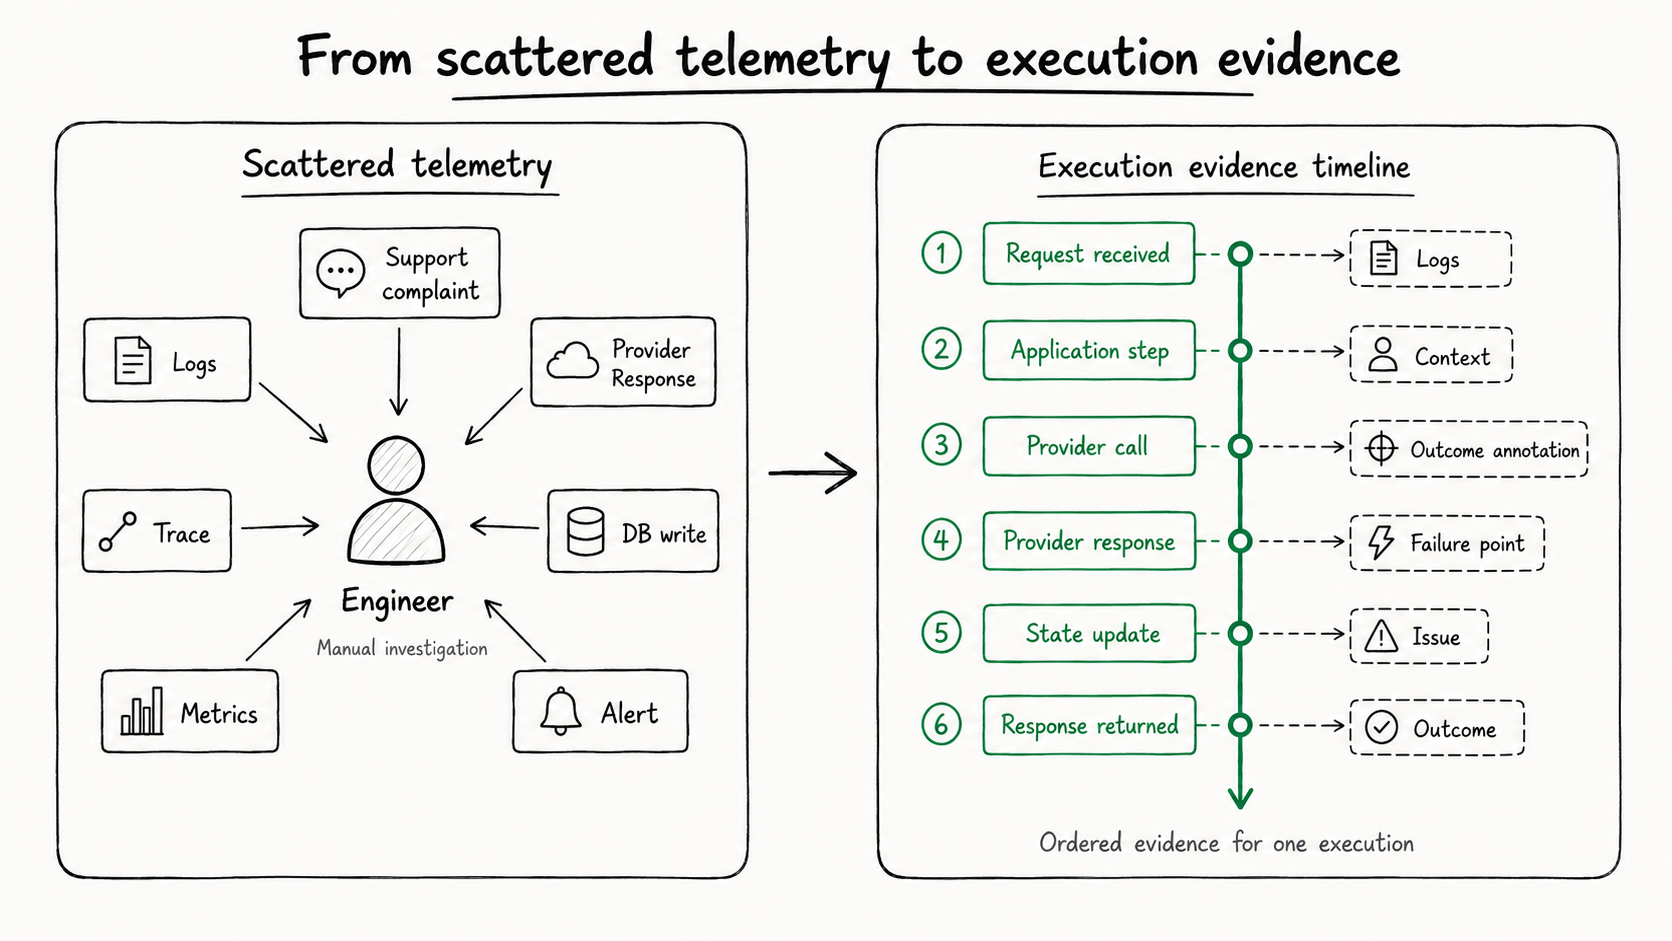
From scattered telemetry to execution evidence.
The common investigation shape looks like this:
Support complaint
Logs
Trace
Metrics
Provider response
Database write
Alert
Each source can be useful.
The problem is that none of them is necessarily organized around the unit of work the engineer is trying to understand.
That leaves the engineer to perform the same reconstruction again and again:
Which request was this?
Which logs belong to it?
Which provider call happened inside it?
What did the provider return?
Was the response mapped correctly?
Was anything persisted?
What did the customer see?
Did this become an issue?
Foveus starts from a different shape:
Execution
→ steps
→ context
→ logs
→ metrics
→ outcome annotations
→ failure point
→ issue
The goal is not to replace every existing telemetry type.
The goal is to organize the evidence around the execution being investigated.
Execution timelines give the investigation a shape.
An execution timeline is an ordered view of how a unit of work unfolded.
For an API request, that might include evidence such as:
Request received
→ application step executed
→ outbound provider call
→ provider response received
→ database write
→ response returned
The exact shape depends on what the application emits, what the SDK captures, and what evidence is available for that execution.
The important part is not only the sequence.
The important part is the evidence attached to the sequence:
- the request context
- the execution steps
- the provider response
- the logs emitted during the execution
- the duration of important operations
- the final outcome
- the identifiers needed to search and correlate the work later
This is where execution timelines become useful.
A timeline does not need to pretend that every system exposes a perfect narrative. Real production systems are messier than that. Some evidence comes from structured steps. Some comes from logs. Some comes from request or response context. Some comes from outcome annotations. Some comes from metrics or linked issues.
The job of Foveus is to organize that evidence around the execution the engineer is investigating, so the team spends less time stitching together scattered telemetry by hand.
Request flow is not the same as decision flow.
One reason production debugging remains difficult is that backend failures are not always path problems.
Sometimes the request reached the right service.
Sometimes the database was available.
Sometimes the provider returned HTTP 200.
Sometimes the trace looks normal.
And still, the customer-visible outcome is wrong.
That is because many failures live in the decision flow:
- Was the customer eligible?
- Which provider was selected?
- Was the provider response interpreted correctly?
- Did the retry policy run?
- Was the operation marked as failed, pending, or successful?
- Did the API return a technically successful response with a business failure inside it?
A trace is good at showing where a request travelled.
It does not always show what the application decided along the way.
Foveus starts from that distinction.
A backend failure is rarely one signal.
Consider a fictional payments-api.
A customer reports that a payment did not complete. The API returned HTTP 200. The frontend showed a pending state. The provider later returned a response. The database has a transaction row. There is a warning log somewhere around the same time.
Nothing here is unusual.
The hard part is reconstructing the actual execution.
The engineer needs to know:
Was the request accepted?
Was the customer resolved?
Was the payment provider selected?
Was the provider call sent?
Did the provider return success, failure, or pending?
Was the response mapped correctly?
Was the transaction updated?
What did the API return?
Did an issue get created?
A metric may show an increase in pending payments.
A trace may show that payments-api called the provider.
A log may say that a provider response was received.
But the investigation needs the relationship between those facts.
That relationship is the execution story.
Why we are starting with .NET backend teams.
Foveus is .NET-first because many serious backend systems run on .NET, and because production debugging in .NET applications often spans APIs, background workers, queues, logs, third-party providers, and database writes.
ASP.NET Core gives us a useful starting boundary: the HTTP request.
That makes API execution investigation a practical first focus. A request has a beginning, an end, headers, route data, response metadata, logs, outbound calls, exceptions, and application context that can be captured carefully.
Worker services are important too, but they are harder to capture automatically in a clean way.
A background job might begin from a queue message, a scheduled task, a consumer, a retry, or a long-running loop. The unit of work is not always obvious from the framework boundary alone.
Foveus already supports useful worker-related telemetry such as logs, logged exceptions, outbound HTTP telemetry, metrics, trace propagation, and some MassTransit hooks, but full automatic per-job execution capture is still evolving.
That distinction matters.
We would rather be precise about what Foveus does well today than pretend every production workflow has the same shape.
What Foveus is building.
Foveus is being built as an execution intelligence product for backend teams.
The goal is to help engineers move from:
Something failed.To:
This execution failed here, after this decision, with this context, and this evidence.Today, Foveus already captures much of the evidence needed for that investigation model: execution details, ordered steps, logs, metrics, context, outcome annotations, failure points, and issue linkage.
The product direction is to make that evidence feel like one coherent execution timeline.
The product focuses on:
- API execution investigation
- execution timelines
- linked logs
- request and response context
- indexed execution context search
- issue investigation
- alert-to-issue-to-execution workflows
- .NET SDK instrumentation
- Serilog integration
- production debugging workflows
The point is not to collect data for its own sake.
The point is to preserve the evidence that explains how a unit of work unfolded.
Context matters, but not all context should be stored.
A production investigation often depends on business context.
Engineers rarely search only by timestamp. They search by things like:
customerIdorderIdtransactionIdrequestIdproviderReference- status
- outcome
- error category
But context capture has to be careful.
The answer is not to dump every payload into an observability tool and hope it becomes useful later. That creates security, privacy, cost, and noise problems.
Foveus is designed around safe, intentional context capture. Context search starts with indexed scalar fields from request, response, and custom execution context.
The goal is to make important fields searchable without turning observability into uncontrolled payload storage.
That is the balance we care about: enough context to explain the execution, with enough restraint to avoid capturing data carelessly.
Alerts should lead to evidence.
An alert is not the investigation.
An alert is a pointer.
Too many alerting workflows stop at the symptom:
Error rate increased.
Latency crossed threshold.
Failure count exceeded limit.
That is useful, but it still leaves the engineer asking:
Which executions explain this?
Foveus is designed around the path from alert to evidence:
Alert
→ Issue
→ Representative execution
→ Timeline
→ Logs and context
→ Next action
The alert should not just say that something changed.
It should help the engineer reach the execution evidence behind the change.
Why the name Foveus.
Foveus is inspired by the fovea, the small part of the retina responsible for sharp central vision.
That metaphor matters because most observability tools widen the field of view. They help teams collect and inspect more telemetry across more systems.
Foveus is focused on the small part of the incident that explains the whole thing.
When detail matters, the fovea is where vision becomes useful.
When production breaks, Foveus is where telemetry becomes understandable.
What we are not claiming
Foveus is not a replacement for logs, metrics, or traces.
It is not a promise that production debugging becomes automatic.
It is not a magic root-cause machine.
Real systems are messier than that: distributed workflows, partial failures, retries, queues, provider inconsistencies, race conditions, missing instrumentation, and data that should not be captured.
That is why we are starting with a narrower claim:
Backend teams need a better way to reconstruct and search the execution evidence behind production failures.
That is what Foveus is being built for.
Private beta.
We are building carefully, with a bias toward accurate execution evidence over noisy visibility. The early product is focused on helping teams understand failed requests, support complaints, provider issues, and production alerts through clearer execution evidence.